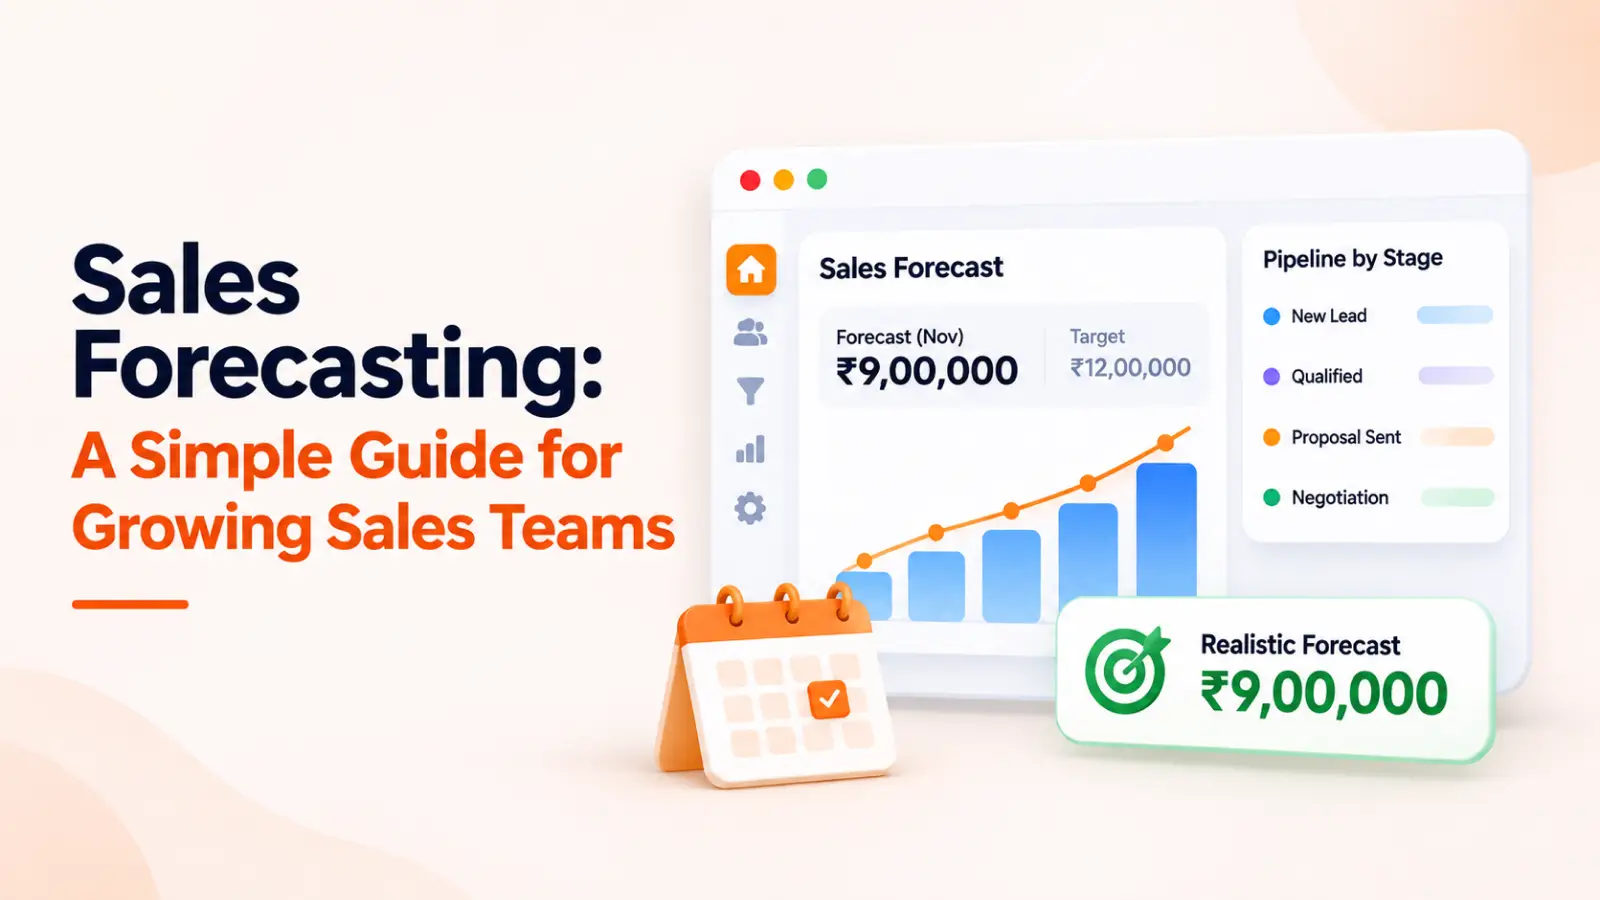
Sales Forecasting: A Simple Guide for Growing Sales Teams
A simple sales forecasting guide for growing teams. Learn how to forecast sales step by step, avoid common mistakes, and use a sales forecast CRM.
- 1What Is Sales Forecasting?
- 2Why Growing Sales Teams Get Forecasts Wrong
- 1. Relying on Rep Optimism Instead of Data
- 2. Deals Sitting in the Wrong Pipeline Stage
- 3. Leads Tracked Across Spreadsheets, WhatsApp and Email
- 3How to Forecast Sales: A Step-by-Step Process
- Step 1: Define Your Sales Stages Clearly
- Step 2: Clean Up Your Pipeline Data
- Step 3: Assign a Win Probability to Each Stage
- Step 4: Calculate Your Weighted Forecast
- Step 5: Review and Adjust the Forecast Every Week
- 4Common Sales Forecasting Methods Compared
- 5Using a Sales Forecast CRM to Get More Accurate Numbers
- Real-Time Pipeline Visibility
- Automatic Activity and Lead Tracking
- AI Insights on Deal Health and Follow Ups
- Reports That Update Without Manual Work
- 6Founder's Review: What We've Learned About Sales Forecasting
- The Forecasting Problem We See Most Often
- What Actually Improved Forecast Accuracy
- One Piece of Advice for Growing Sales Teams
- 7Sales Forecasting Metrics Every Team Should Track
- 8Sales Forecasting Mistakes to Avoid
- 9A Simple Sales Forecasting Template to Start With
- 10Conclusion
- 11FAQs
- Question: How often should a growing sales team update its forecast?
- Question: Which forecasting method is best for a small team?
- Question: What is the best way to learn how to forecast sales with little historical data?
- Question: Can a sales forecast CRM replace spreadsheets completely?
- Question: What is a good sales forecast accuracy rate?
Ask a sales head what next month looks like, and you will usually get a confident number. Ask how that number was built, and the answer gets a lot quieter.
Most growing teams forecast on instinct, and instinct works well enough until there are six reps, four lead sources, and a pipeline nobody fully trusts.
Our team has worked with thousands of businesses, and we often see this gap. So we wrote this sales forecasting guide the way we would explain it to a new sales manager on our own team, with plain math, real examples, and steps you can actually follow.
What Is Sales Forecasting?
Sales forecasting is an estimate of how much revenue your team will close in a set period, like a month or a quarter. It is built from the deals already in your pipeline, your past results, and how your team usually performs.
A forecast is not a target. A target is what you want to happen. A forecast is what your data says is likely to happen.
Here is a simple example. Meher runs a travel agency in Jaipur with six sales reps. Her target for November is ₹12 lakh. Her pipeline shows ₹28 lakh in open deals, so on paper November looks easy.
But when she checks how many deals at each stage usually close, the realistic number comes to about ₹9 lakh. That ₹3 lakh gap is exactly what a forecast is meant to show, early enough to do something about it.
For a growing team, this makes a real difference:
Accurate forecast → better hiring decisions
Accurate forecast → steady cash flow planning
Accurate forecast → targets your reps actually believe in
Wrong forecast → missed targets + stressed team + rushed discounts at month end
Why Growing Sales Teams Get Forecasts Wrong
In our experience, forecasts rarely go wrong because of bad math. They go wrong because the data going into the math is messy.
1. Relying on Rep Optimism Instead of Data
Ask any rep about their deals, and most will say "this one is almost done." Reps are hopeful by nature, and that helps them sell. It does not help them forecast. When the forecast is just the sum of what reps feel, it almost always comes out too high.
2. Deals Sitting in the Wrong Pipeline Stage
We often see deals marked as "Negotiation" when the customer has not replied in three weeks. Each stage carries a different chance of closing, so one stale deal in a late stage quietly inflates the whole forecast.
3. Leads Tracked Across Spreadsheets, WhatsApp and Email
This one comes up with almost every team we talk to. Some leads live in a spreadsheet, some in a rep's personal WhatsApp, some in email threads. If a deal is not recorded in one place, it cannot be counted properly. Moving these chats into a connected WhatsApp CRM setup is often the first fix we suggest, because a forecast can only be as complete as the pipeline behind it.
How to Forecast Sales: A Step-by-Step Process
Our team believes the best way to learn how to forecast sales is to start simple and improve with every cycle. Here is the process we recommend.
Step 1: Define Your Sales Stages Clearly
Every stage needs a clear rule. For example, a deal moves to "Proposal Sent" only when the proposal is actually shared, not when the rep plans to share it. Clear rules = consistent data.
Step 2: Clean Up Your Pipeline Data
Close deals that have gone silent. Update deal values that have changed. Merge duplicate leads. This step feels boring, but we have seen it change a forecast more than any formula.
Step 3: Assign a Win Probability to Each Stage
Look at your past deals and check what share of them closed from each stage. If you do not have enough history yet, start with sensible estimates and correct them every month.
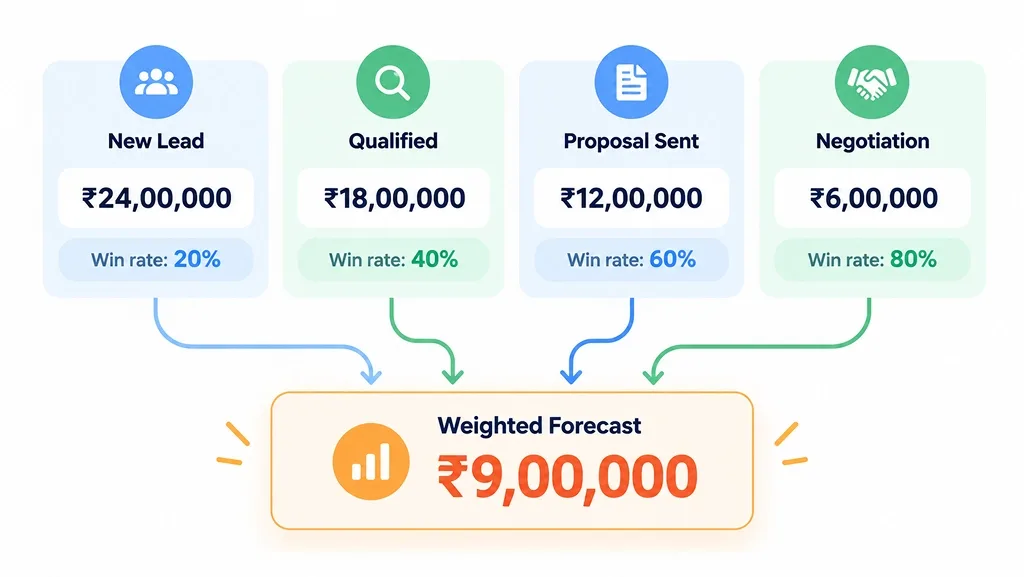
Step 4: Calculate Your Weighted Forecast
This is the method we suggest for most growing teams. The formula is simple:
Deal Value × Win Probability = Weighted Value
Here is how Meher's pipeline looks when she applies it:
Pipeline Stage | Open Deals | Total Value | Win Probability | Weighted Value |
|---|---|---|---|---|
New Lead | 20 | ₹10,00,000 | 10% | ₹1,00,000 |
Qualified | 12 | ₹8,00,000 | 25% | ₹2,00,000 |
Proposal Sent | 8 | ₹6,00,000 | 50% | ₹3,00,000 |
Negotiation | 4 | ₹4,00,000 | 75% | ₹3,00,000 |
Total | 44 | ₹28,00,000 | ₹9,00,000 |
So her pipeline shows ₹28 lakh, but her realistic forecast is ₹9 lakh. That one table changed how she planned her month: more follow-ups on proposals, fewer assumptions about new leads.
Step 5: Review and Adjust the Forecast Every Week
A forecast made on the 1st and checked on the 30th is just a guess with a date on it. We recommend a short weekly review covering three questions: which deals moved forward, which slipped back, and which went quiet.
Common Sales Forecasting Methods Compared
There is no single right method. The best one depends on how much data your team has and how long your sales cycle is.
Method | How It Works | Best For | Watch Out For |
|---|---|---|---|
Historical Forecasting | Uses past sales to predict the next period | Teams with steady, seasonal sales | Ignores changes in market or team size |
Opportunity Stage Forecasting | Multiplies each deal value by its stage probability | Growing teams with a clear pipeline | Needs honest, updated stages |
Sales Cycle Length Forecasting | Compares how long a deal has been open with your average cycle | Businesses with predictable cycles | Less useful for short or irregular deals |
Lead Driven Forecasting | Estimates revenue from lead volume and conversion rate by source | Teams running ads or campaigns | Lead quality can change quickly |
AI-Based Forecasting | Reads deal activity, response times, and past patterns together | Teams with clean CRM data | Only as good as the data behind it |
Most teams we work with start with opportunity stage forecasting, then add other methods as their data gets better.
Using a Sales Forecast CRM to Get More Accurate Numbers
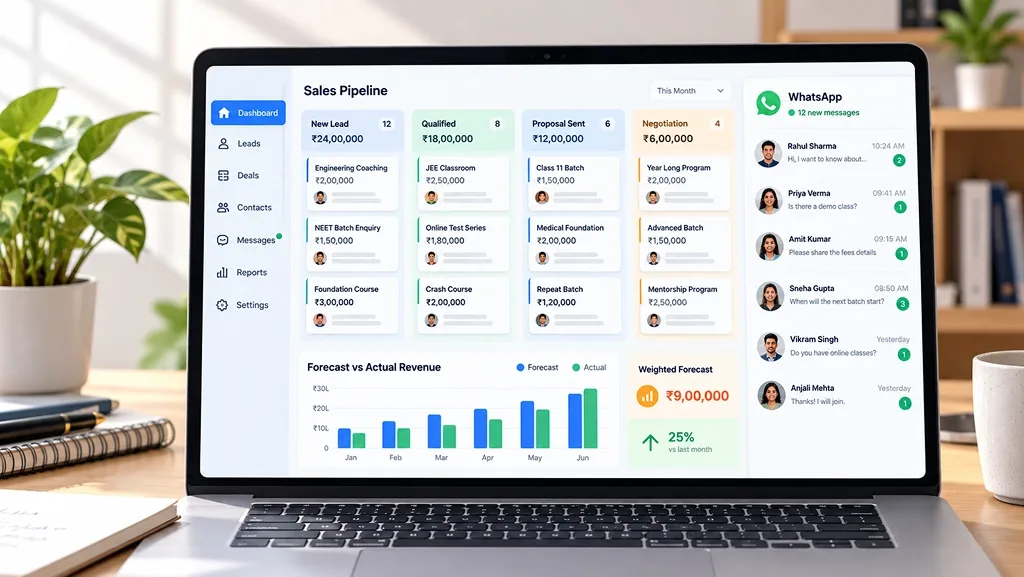
A spreadsheet can hold a forecast. A sales forecast CRM keeps it alive. The difference is simple: the CRM updates as your team works, instead of waiting for someone to fill in cells on a Friday evening.
Spreadsheet → updated once a week, depends on memory
CRM → updated with every call, message, and stage change
Real-Time Pipeline Visibility
In AiEngage, every deal sits in a visual sales pipeline. A manager can see at a glance how much value sits in each stage and which deals have not moved in days.
Automatic Activity and Lead Tracking
Leads from WhatsApp, calls, website forms, and ads land in one place, and every conversation is logged against the deal. Nothing depends on a rep remembering to update a sheet.
AI Insights on Deal Health and Follow Ups
AiEngage can summarize conversations, qualify incoming leads, and automate follow-ups, so deals do not go cold just because someone forgot to reply.
We have also seen how an AI chatbot that qualifies WhatsApp leads keeps the early pipeline stages cleaner, because only serious buyers move forward.
Reports That Update Without Manual Work
Win rates, stage conversions, and rep performance update on their own in CRM reports and analytics. That gives you real numbers for stage probabilities, without digging through old records.
Founder's Review: What We've Learned About Sales Forecasting
We asked Sachin Dhanotiya, Founder of AiEngage CRM, to share what he has learned for this sales forecasting guide. Here is his take, in his own words.
The Forecasting Problem We See Most Often
"The most common problem I see is not a lack of tools. It is that the real sales activity happens in one place and the forecast is built in another. Conversations happen on WhatsApp and calls, but the forecast lives in a spreadsheet someone updates on Monday. By the time the numbers reach the owner, they are already old."
What Actually Improved Forecast Accuracy
"The teams that forecast well are not doing anything fancy. They keep every lead and conversation in one system, they have clear rules for each stage, and they review the pipeline every week without skipping.
When follow-ups are automated, fewer deals go silent, and the forecast stops getting surprised at month-end."
One Piece of Advice for Growing Sales Teams
"Build your forecast on the deals you can see, not the deals you hope for. A slightly lower number that your team trusts is far more useful than a big number nobody believes."
Sales Forecasting Metrics Every Team Should Track
These five numbers tell you whether your forecast is built on solid ground:
Win Rate = Deals Won ÷ Total Deals Closed × 100
Average Deal Size = Total Revenue Won ÷ Number of Deals Won
Sales Cycle Length = Average days from first contact → deal closed
Pipeline Coverage = Total Pipeline Value ÷ Sales Target
Lead to Deal Conversion Rate = Deals Won ÷ Total Leads × 100
Let's put two of these together. If Meher's team closed 40 deals last quarter and won 10, her win rate is 25%.
That means she needs roughly 4 times her target in the pipeline (because 1 ÷ 0.25 = 4).
Her ₹28 lakh pipeline against a ₹12 lakh target is only about 2.3 times, which tells her early that she needs more qualified leads, not just more pushing on existing deals.
Sales Forecasting Mistakes to Avoid
Here are the mistakes we see most, along with what works better:
(−) Forecasting once a quarter → (+) Review the forecast every week
(−) Keeping stalled deals open → (+) Set a rule, like no activity in 14 days = review or close
(−) Mixing new and repeat revenue → (+) Forecast them separately
(−) Nobody owns the forecast → (+) Give one person clear ownership
(−) Switching tools every few months → (+) Pick one system and build habits around it
If your team is still deciding on that one system, comparing the leading CRM software options side by side can save you a costly switch later.
A Simple Sales Forecasting Template to Start With
You do not need a complex model to begin. Here is a basic layout your team can copy today:
Deal Name | Stage | Deal Value | Win Probability | Expected Close | Weighted Value |
|---|---|---|---|---|---|
Mehta family hotel package | Proposal Sent | ₹2,40,000 | 50% | 15 Nov 2026 | ₹1,20,000 |
Corporate offsite, 40 guests | Negotiation | ₹6,00,000 | 75% | 28 Nov 2026 | ₹4,50,000 |
Goa honeymoon trip | Qualified | ₹1,20,000 | 25% | 5 Dec 2026 | ₹30,000 |
Total | ₹9,60,000 | ₹6,00,000 |
Add every open deal, update the stage each week, and the weighted total becomes your forecast. Once this habit sticks, moving it into a CRM is the natural next step.
Conclusion
A sales forecast works a lot like a weather report. It will never be perfect, but when it is checked often, it tells you whether to plan for sunshine or carry an umbrella. Our team would rather see a business keep a modest forecast that it updates every week than build a perfect spreadsheet that gets opened once a quarter.
Use this sales forecasting guide as your starting point: set clear stages, keep your pipeline honest, and let the numbers guide your next move. When you are ready to stop chasing data across chats and sheets, AiEngage can bring your leads, conversations, and pipeline into one place.
See Your Pipeline Come Alive in AiEngage
FAQs
Question: How often should a growing sales team update its forecast?
Answer: We recommend a quick review every week. Monthly updates are too slow for a growing team, because deals can stall or move a lot in a few days.
Question: Which forecasting method is best for a small team?
Answer: Opportunity stage forecasting is usually the easiest place to start. It only needs your current pipeline and a win probability for each stage.
Question: What is the best way to learn how to forecast sales with little historical data?
Answer: Start with estimated win probabilities for each stage, track what actually closes for two or three months, and then adjust the percentages using your real results.
Question: Can a sales forecast CRM replace spreadsheets completely?
Answer: For most teams, yes. A CRM records deals, conversations, and stage changes as they happen, so the forecast stays current without manual updates.
Question: What is a good sales forecast accuracy rate?
Answer: There is no single number that fits every business. A practical approach is to compare your forecast with actual results every month and aim to shrink the gap over time.

I help businesses simplify marketing, sales, and customer support through AI and automation. At AiEngage CRM, we bring lead management, WhatsApp, calling, email campaigns, meetings, and support into one connected platform. Our vision is to help businesses run smarter with AI, empowering teams to streamline everyday work, strengthen customer relationships, and drive sustainable growth.